
Report 3 · All life · East Africa
Collection, storage and publication of DNA records from East Africa
750,263 DNA records from nine East African countries are on GBIF. No publisher of these records is in East Africa, and institutions in East Africa hold 3 percent of the specimens.
Summary
DNA barcoding is a method that identifies a species from a short section of DNA from one or more specific genes. Environmental DNA, or eDNA, is DNA collected from samples such as soil, water, snow or air, and not taken directly from an organism.1
GBIF, the Global Biodiversity Information Facility, holds records made with both methods. It also holds DNA sequences from public archives and records of tissue kept in DNA banks. This report calls all four kinds DNA records. It counts the DNA records from nine East African countries (Burundi, DR Congo, Ethiopia, Kenya, Rwanda, Somalia, South Sudan, Tanzania and Uganda) on GBIF as of 14 October 2026.2
GBIF holds 750,263 DNA records from the region, in 28 datasets. They are 350,083 eDNA records, 253,332 barcoded specimens, 109,994 archive sequences and 36,854 records in DNA and tissue banks. An international consortium and organisations in 11 countries published the datasets. None of them is in East Africa.
Where the specimens and bank samples are held
- Canada160,758 · 55%
- East Africa9,318 · 3%
- Elsewhere120,110 · 41%
Who collected the barcoded specimens
- Joseph Hubert Masoy116,772 · 46%
- Next three collectors37,892 · 15%
- Others or none named98,668 · 39%
Where the barcodes were sequenced
of 257,029 barcode sequences, at the University of Guelph in Canada
Records by organism group
- Insects 32%
- Fungi 24%
- Bacteria 17%
- Other groups 26%
1. Wikipedia, DNA barcoding and Environmental DNA.
2. GBIF, gbif.org.
1. Publication of the records
A record reaches GBIF through a publisher, the organisation that registers the dataset. The publisher is often a different organisation from the one that collected the sample.1
The records are of four kinds. A barcoded specimen is an animal or plant with a short standard DNA sequence, called a barcode. An eDNA record is DNA read from a sample of soil, air or water. An archive sequence is a sequence in GenBank or the European Nucleotide Archive. A bank record is tissue or DNA that an institution keeps in storage.2
An international consortium and organisations in 11 countries published the 750,263 records. No publisher is in East Africa. Three organisations published 83 percent of the records. They are the International Barcode of Life Consortium (253,320), PlutoF (253,177) and European Nucleotide Archive (EMBL-EBI) (118,096).3
1. GBIF, Data publishers.
2. The sequence archives, GenBank and European Nucleotide Archive.
3. The largest dataset of each publisher on GBIF, International Barcode of Life project (iBOL), Global soil organisms and INSDC Sequences.
DNA records by country of collection, method and country of publisher
2. Location of the specimens
A barcoded specimen and a bank sample are physical objects. After the laboratory reads the DNA, an institution keeps the object, and the record names that institution. A researcher who wants to examine a specimen must go there or ask for a loan. eDNA records and archive sequences have no specimen, so they are not in this section.1
290,186 records are specimens or bank samples. Institutions in Canada hold 160,758 of them, 55 percent. The Centre for Biodiversity Genomics at the University of Guelph holds 154,660. Norway is second, with 32,467. Institutions in East Africa hold 9,318, 3 percent. The largest are the National Museums of Kenya (3,618), the International Centre of Insect Physiology and Ecology (1,944) and the African Butterfly Research Institute (1,483).2
Sequencing follows the same route. The two barcoding laboratories at the University of Guelph ran 205,888 of the 257,029 barcode sequences from the nine countries, 80 percent. GBIF does not name the laboratory, so this figure is from BOLD, the Barcode of Life Data System, read on 11 November 2026.3
1. Darwin Core, the record standard GBIF uses, dwc:institutionCode.
2. The holders, Centre for Biodiversity Genomics, National Museums of Kenya and icipe.
3. BOLD, the Barcode of Life Data System, BOLD portal.
Specimens collected in East Africa, by location of the holder
3. Sampling locations
648,542 of the 750,263 records give coordinates. The map puts them in squares of half a degree, about 55 km on a side. A grey square has GBIF records of some kind and no DNA record.1 Archive sequences often give only the country, so most of them are not on the map.2
1,021 of the 2,839 squares with a GBIF record have a DNA record. Half of all DNA records with coordinates are in 14 squares. The 345,747 eDNA records come from 204 sampling points, and the 229,512 barcoded specimens from 5,902. Somalia has 1,333 DNA records and South Sudan has 1,503.
1. GBIF, Occurrence search.
2. Darwin Core, dwc:decimalLatitude and dwc:decimalLongitude.
DNA records by half-degree square
4. Years of collection
Each record keeps its date of collection.1 The first chart has a row for each country and a column for each year from 2000. A large project appears as one large circle, with one team and one method in one or two years. Regular sampling appears as a row of circles of similar size.
In most of the countries, one year accounts for a large share of the records. Kenya had 50 percent of its records in 2015. DR Congo had 45 percent of its records in 2018. Ethiopia had 45 percent of its records in 2019. Rwanda had 89 percent of its records in 2018. Burundi had 88 percent of its records in 2020. These are shares of the records dated 2000 or later. For the nine countries together, the most records were collected in 2018, with 114,959, most of them eDNA.
1. Darwin Core, dwc:eventDate.
DNA records by country and year of collection
DNA records by year of collection and method, nine countries
5. Organism groups
In each of the three groups below, most records come from one method. 90 percent of the records of insects are barcoded specimens. 93 percent of the records of fungi are eDNA. 91 percent of the records of bacteria are eDNA.1
Insects, fungi and bacteria make up 74 percent of the DNA records. 75 percent of the 238,775 insect records name no species. They carry a sequence code or a higher rank, such as a family. Such a record shows that an insect of that family was at the place. It cannot be matched to a known species, so it adds nothing to the count in section 6.2
1. GBIF, GBIF Backbone Taxonomy.
2. Ratnasingham and Hebert, PLOS ONE, 2013, A DNA-based registry for all animal species, the Barcode Index Number (BIN) System.
DNA records by organism group and family
6. Species coverage
GBIF’s species lists name the species known from each country. MRI matched the DNA records to these lists by species name. The count covers the 39 classes with 200 or more listed species. A class is a large group such as insects or birds. A species with one DNA record counts the same as a species with a thousand.1
The lists name 95,210 species, and 14,150 of them have a DNA record, 15 percent. Among the classes named on the chart, moulds (eurotiomycetes) have the largest share, 56.7 percent, and millipedes the smallest, 0.6 percent. The share is 39 percent for amphibians (222 of 568), 38 percent for mammals (450 of 1,200), 27 percent for reptiles (293 of 1,100), 22 percent for bony fishes (1,015 of 4,534), 16 percent for birds (353 of 2,259) and 15 percent for insects (5,074 of 33,941). The species lists are from GBIF as of 10 October 2026.
1. GBIF, Species search.
Known species and share with a DNA record, by class
7. Collectors
Most barcoded specimens name the person or team that collected them. This section covers the 253,332 barcoded specimens. 212,992 of them name a collector. The name is as the record gives it, so one person can appear under two spellings.1
The specimens name 2,171 collectors or collecting teams. Joseph Hubert Masoy is the collector of 116,772, 46 percent, all from Tanzania between 2019 and 2022. Four collectors account for 61 percent of the barcoded specimens.
1. Darwin Core, dwc:recordedBy.
Barcoded specimens by collector
Specimens collected by Joseph Hubert Masoy
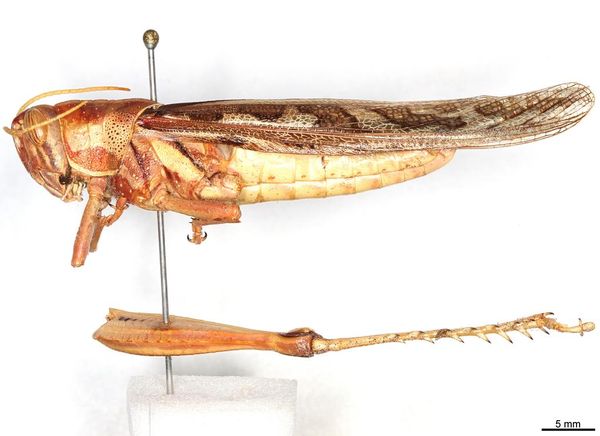
Collector profiles
Four of the collectors with the most barcoded specimens. A GBIF record gives a collector’s name, a place and a date. It does not say who the person is or who they work for, and MRI did not check.
Joseph Hubert Masoy
- 116,772
- DNA records
- 604
- species named
- 7%
- of records name a species
- 62%
- are flies (Diptera)
Most records are from Mara, Arusha and Lamadi Chiriki House. Almost all of the specimens are at the Centre for Biodiversity Genomics.
Margaret Kinnaird
- 21,652
- DNA records
- 203
- species named
- 9%
- of records name a species
- 46%
- are flies (Diptera)
Most records are from Mpala Research Centre. Almost all of the specimens are at the Centre for Biodiversity Genomics.
Robert Copeland
- 14,469
- DNA records
- 181
- species named
- 8%
- of records name a species
- 39%
- are flies (Diptera)
Most records are from Kaya Kinondo Sacred Forest and Indigenous forest. 81 percent of the specimens are at the Centre for Biodiversity Genomics. The records use two spellings, Robert Copeland and RS Copeland.
Dino Martins
- 4,581
- DNA records
- 98
- species named
- 5%
- of records name a species
- 57%
- are flies (Diptera)
Most records are from Turkana. 99 percent of the specimens are at the Centre for Biodiversity Genomics.
8. Methods and sources
- DNA records. Occurrence records for Tanzania, Kenya, DR Congo, Uganda, Ethiopia, Rwanda, Burundi, Somalia, South Sudan, from GBIF as of 14 October 2026. A record counts as DNA when its dataset is on MRI’s list of 28 DNA datasets. On 11 November 2026 GBIF’s own API marked 712,942 records as sequenced, and 100 percent of them were in a listed dataset.1
- Publishers. The country of a publisher is the country GBIF gives for the organisation that published the dataset. It is not always the country where the specimen is held or where the DNA was sequenced.
- Known species. GBIF’s species lists as of 10 October 2026, matched to the DNA records by species name. A species whose name changed counts as having no DNA record.
- The map. 30 DNA records have coordinates outside the map and are not drawn. Archive sequences often give only the country, so they have no dot. The borders are Natural Earth 1:50m Admin 0 – Countries, version 5.1.2, public domain. Natural Earth draws Somaliland apart from Somalia; GBIF gives both the code SO, so the map draws no line between them.2
- Holders. The holder is the institution code on a barcoded specimen or a bank sample. MRI assigned a country to the holders with the most specimens by hand, from the holder’s name. A holder named “Research Collection of” a person is a private collection.
- Years. The year is the year of collection on the record. The figure by country starts at 2000.
- Collectors. A collector is a name as the records spell it. MRI joined the two spellings of Robert Copeland by hand for his profile and joined no other names.
- Sequencing laboratories. From BOLD’s public portal summary for each of the nine countries, read on 11 November 2026. MRI did not check these totals against the BOLD website.3
GBIF data as of 14 October 2026 · borders from Natural Earth 1:50m Admin 0 – Countries, version 5.1.2, public domain